Where have the Colorado and Gunnison Rivers been in the past, where can we expect them to migrate, and what can we do about it? These questions drove the recent Grand Valley Fluvial Hazard Zone Mapping Project for Mesa County Colorado. Sponsored by the Grand Valley River Corridor Initiative, this project involved mapping the corridor within we we expect to encounter fluvial geomorphic (riverine) processes as well as the buffer beyond which we expect some influence by the river within adjacent hillslopes.
This produced a map and project ideas and recommendations for managing the river corridor. Read the report here. In some cases this might involve engineering projects to “train” the river around important infrastructure. In others it might involve making room for the river to migrate naturally. Natural channel migration supports healthy aquatic and riparian habitat for threatened and endangered species that live in this corridor. Mesa County will be hosting the FHZ map online, stay tuned!
After Jennifer Shanahan (City of Fort Collins Natural Areas Program) presented a great framework on how to approach dynamism and risk tolerance in urban stream corridors at the 2019 Sustaining Colorado Watersheds Conference, she, myself, and Sharon Bywater-Reyes (University of Northern Colorado) have been conversing on how to engage stormwater and public works departments on the question of dynamism and resiliency in urban stream corridors. We presented these ideas and some applications with the Colorado Riparian Association, Colorado Stream Restoration Network, hosted by Coalitions and Collaboratives, Inc (CoCo). We hope to continue this conversation with the ultimate goal of engaging storm water and flood control utilities and districts as well as public works departments on how to manage urban stream corridors for dynamism and community and ecological resilience. Contact me to join the discussion!
I had the opportunity to present at this year’s Colorado Association of Stormwater and Floodplain Managers virtual conference on our recent publication of the Colorado Fluvial Hazard Management Program. This presentation covers the basic theory behind mapping the Fluvial (geomorphic) Hazard Zone (FHZ), methods for mapping the FHZ, and discusses its applications. Learn more about the Colorado FHZ program here: https://www.coloradofhz.com/ .
Our planet is warming and the fish know it. Cold water species (think salmon and trout) need cold water to thrive (1). Indeed, TMDLs (Total Maximum Daily Loads) have been established by the EPA and the State of Oregon on temperature in some streams because they are becoming too warm for the native fish (2) (3). TMDLs are typically made for things like too much bacteria or nutrients in a waterbody. Cooling an entire stream or river down is hard to do (we would need a larger refrigerator and a power plant to power it). However, we might be to re-create “thermal refuges” or spots within a stream where the water is a little cooler. Think of these as a summertime mist tent or a splash pad in the city. A research project funded by the Bureau of Reclamation, Science and Technology Program will investigate if and how thermal refuges can be re-created in warming streams.
As waters warm, these fishes experience stress, leading to poor growth and reproduction. Think about how you feel during a heatwave – It’s hard to function! Many of these natives in the Pacific Northwest also happen to be listed as endangered or threatened with Endangered Species Act and are party to legal settlements between native american tribes and state and federal governments. Tribal members sustain their cultures and nutrition on salmon.
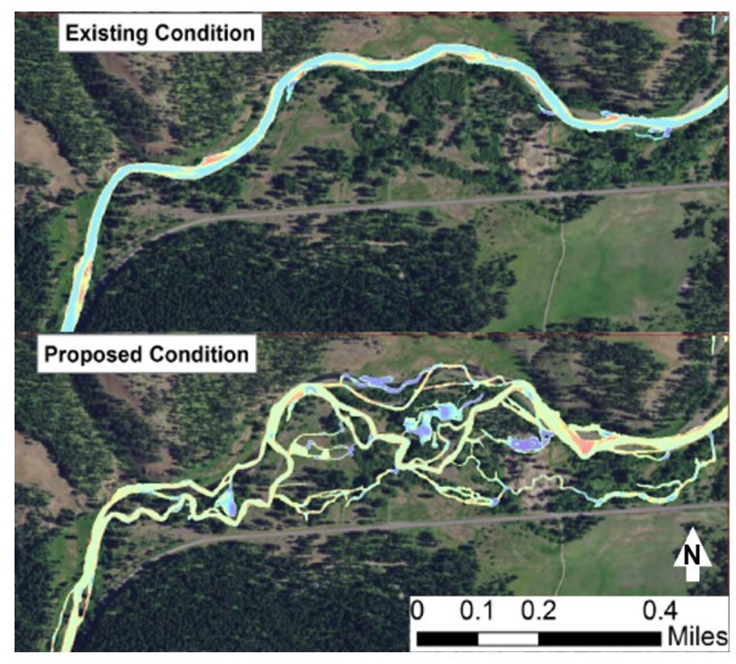
Bird Track Springs stream rehabilitation study reach.
That is why some organizations are looking for opportunities to cool streams down. Fish biologists and stream engineers cannot turn the global thermostat down, but they can look for other opportunities for cooling. Climate change is not the only culprit for stream warming in many stream systems. Removal of riparian vegetation (trees and shrubs), and human manipulation of streams themselves can lead to warming. With less shading, more sunlight transfer more heat energy to streams. Also, if we take wood out of stream and channelize them, then we loose the complexity (think pools, meander bends, wood jams) that allows stream to have deeper, cooler spots as well as exchange with nearby groundwater, called the hyporheic zone (hypo: below, rheos: river).
The Bureau of Reclamation’s Pacific Northwest along with the Confederate Tribes of the Umatilla Indian Reservation along with other partner groups have been rehabilitating streams in the Grande Ronde basin along with others to counteract the interventions humans have made on stream systems that result in poor habitat quality for salmon and trout species. They are taking simplified streams and intentionally making them “messy” (4). By doing so, they hope to create more and higher quality habitat for these fishes as well as restoring what are known as “thermal refuges”.
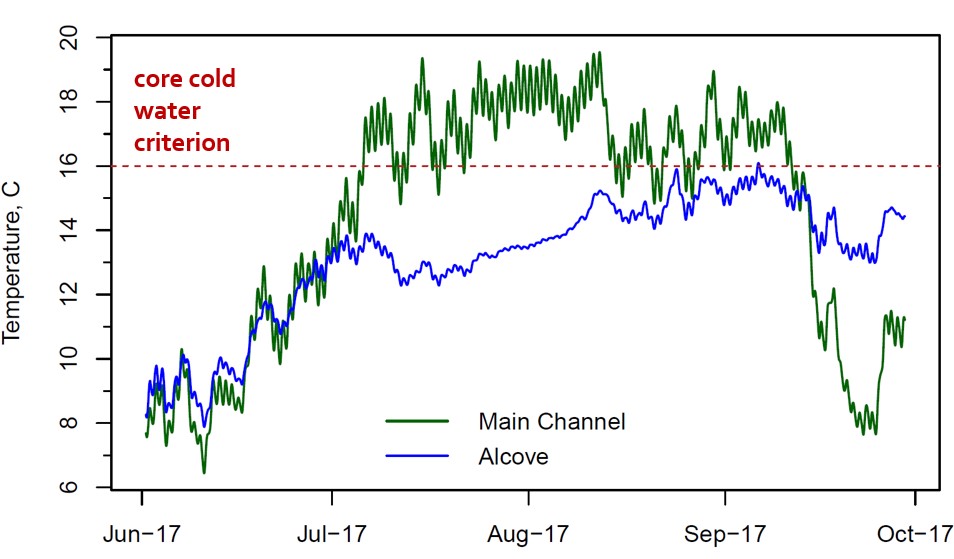
A buffered temperature signal (blue) compare to the main stem temperature (green) measured in an alcove or pool adjacent to the main stem. It is thought that hyporheic flow is causing this buffered temperature which may serve as a thermal refuge for cold-water fishes. From the Southern Cross Reach on Catherine Creek. Data from CTUIR.
By re-introducing sharp meander bends, pools, riffles, and a metric shit-ton of wood in these stream, they hope to also encourage hyporheic exchange: driving surface water into the bed and banks where it can mix with cooler groundwater (5). When surface water enters the hyporheic zone, it might cool, it might also simply be lagged or buffered (6). When it exits the hyporheic zone hours, days, or even months later, its temperature might be offset just enough to result in local spots of cooler water during the summer time or warmer water during the winter time.
A team of fish biologists, stream restoration engineers, hydrologists and geomorphologists will be studying if and how thermal refuges can be re-created by certain stream rehabilitation practices. The Grande Ronde River at Bird Tracks Springs in northwest Oregon is our test subject. A stream rehabilitation project will be completed there this winter. Our team has installed a network of groundwater monitoring wells, surface water level and temperature loggers, along with cameras to monitor the temperature and flow patterns throughout this site before and after the rehabilitation project. This network along with measurements of the exchange of surface water with the hyporheic zone and a groundwater flow model will help us test to what extent hyporheic exchange has been enhanced, whether thermal refuges have been created, and whether fish are using them. Our preliminary results will be available in 2021.
For more information on the project check out the video below and also see our article on this project in the Bureau of Reclamation, Science and Technology Office’s publication Knowledge Stream. You can also find out more about our research project in our recent conference paper on it, available HERE.
Our research team includes:
Bureau of Reclamation, Technical Services Center, Sedimentation and River Hydraulics Group
Bureau of Reclamation, Pacific Northwest Region, River Systems Restoration Group
Confederated Tribes of the Umatilla Indian Reservation
Oregon Department of Fish and Wildlife
Grande Ronde Model Watershed
University of Idaho
Colorado Mesa University / University of Colorado, Boulder
(1) Schindler, D.W. 1997. “Widespread effects of climatic warming on freshwater ecosystems in North America,” Hydrological Processes, 11(8), pp.1043-1067.
(2) ODEQ (Oregon Department of Environmental Quality). 2000. “Upper Grande Ronde River Sub-Basin Total Maximum Daily Load (TMDL),” Oregon Department of Environmental Quality, Water Quality Division, Portland, Oregon.
(3) Ruesch, A.S., Torgersen, C.E., Lawler, J.J., Olden, J.D., Peterson, E.E., Volk, C.J. and Lawrence, D.J. 2012. “Projected climate-induced habitat loss for salmonids in the John Day river network, Oregon, USA,” Conservation Biology, 26(5), pp.873-882.
(4) Wohl, E. (2016). Messy river are healthy rivers: The role of physical complexity in sustaining ecosystem processes. River Flow Conference Proceedings. Iowa City, IA.
(5) Hester, E.T. and Gooseff, M.N. 2010. “Moving beyond the banks: Hyporheic restoration is fundamental to restoring ecological services and functions of streams,” Environmental Science and Technology. 44(5): 1521-1525.
(6) Arrigoni, A. S., Poole, G. C., Mertes, L. A. K., O’Daniel, S. J., Woessner, W. W., & Thomas, S. A. 2008. “Buffered, lagged, or cooled? Disentangling hyporheic influences on temperature cycles in stream channels,”Water Resources Research, 44(9), 1–13.
The answer is the 1% annual chance flood… or maybe something else that is less of a mouthful. The problem is, “the 100-year flood” is catchy, headline grabbing, and easy to say. The other problem is, it is misleading.
Think of a 1% annual chance (100-year) flood as having a 1% chance of occurring in any year. When you flip a coin, each flip is independent from the next. Just because you got tails on one flip doesn’t mean you will get heads on the next. Heads and tails each have a 50% chance of coming up on every flip (unless you stink at flipping coins like me).
Statistical hydrology is much more complicated than flipping coins, but in most cases we can treat the magnitude of floods that occur on a river in a given year as independent from year to year. So, instead of flipping a coin, we are rolling a 100-sided dice each year.
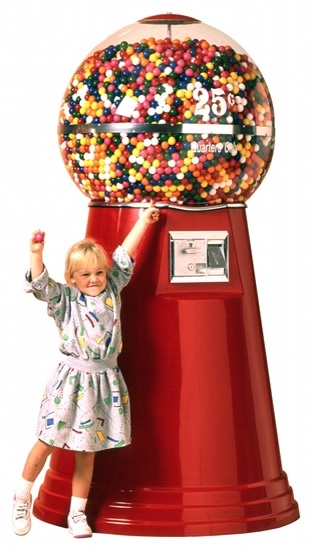
Or, think of a bowl of 100 gumballs in which 99 are blue and one is red. The red gumball is the 1% annual chance (100-year) flood gumball. Close your eyes, reach in and pick out a gumball. Did you get the red one? No? Yay! No catastrophic flood for you (unless you picked the tiny black 0.2% annual chance (500-year) flood gumball!). Now, put the gumball back in the bowl and pick again. Each time you pick (with replacement!) you have a 1% chance of grabbing that red gumball. Each time you pick represents a year. By replacing the gumball you pick each time, each time you pick is independent from the previous and future picks. Now you are a hydrologic statistician! If you pick 30 times with replacement and get 100 of your friends to do the same, about 26 of your friends will pick the red gumball at least once in their 30 picks. This means that over a 30-year mortgage you have a 26% chance of experiencing a 100-year flood!
Even if we all do a better job of naming and understanding floods by engaging in a nationwide campaign to teach politicians, planners, and the public basic statistics, we still run into another problem with floods: predicting how often and how big extreme floods will occur with certainty is not possible! We run into a few of problems: infrequent floods may be occurring every month across the country, but are much more rare for a given river or stream. Our stream and river gages, maintained by the USGS, have limited data and we have to use statistics once again to predict how big the 1% annual chance flood will be. Let me tell you, there are some serious error bars on that prediction. Another problem is climate change. Our record of floods from the past may not represent the future. In some places, floods are expected to become more frequent and severe as where and how much water is in the atmosphere changes. Finally, translating a flood (flow rate or discharge value) to a floodplain map has its own uncertainties because we once again have to use another model to do that. Add population growth and the potential for more people to build in floodplains and we have a real pickle that has been in the making for decades.
So, what do we do? Many things (silver buckshot). First, we need to map the floodplains of the country. Too many communities do not have their floodplains mapped and FEMA is slowly working on this. But due to funding deficiencies, its moving too slow. Second, we can set more restrictive floodplain standards for housing and critical infrastructure. In the face of uncertainty, we can use a better safety factor for design. This might mean building outside of the 0.2% annual chance (500-year) floodplain instead of the 100-year floodplain. Land use decisions such as where a new development can go in are made at the county and city levels, which often lack resources or political will to restrict development in floodplains. We can also shore up the National Flood Insurance Program, managed by the federal government. This program has been subsidizing the cost of living in floodprone areas and is based on faulty floodplain maps and running out of money fast.
The latter three recommendations are politically challenging. At some point, local, state, and federal governments will get their acts together as the natural disasters keep rolling in year after year.
The Bureau of Reclamation (my former employer) spent its first 90+ years of existence constructing and managing water impoundments (i.e., dams and reservoirs) and conveyances (canals and ditches). This work helped develop the West and has created and supported a multi-billion dollar agricultural industry from alfalfa fields in Colorado, to orchards in Washington state to greens and produce grown in the California Central Valley. After the Endangered Species was passed and the environmental movement kicked off in the 1960s and 70s, the negative impacts of these projects on river ecosystems came to bare. Now, after decades of legal battles and eventual settlements, Reclamation and the federal government fund over a dozen endangered species recovery programs. These programs have a range of federal, state, and local partners as well as funding sources (often from the energy generated by the dams that caused the impacts in the first place). The programs are carried out on massive river systems from the Upper Columbia River Basin to the Colorado River in the Grand Canyon. Recovery effort typically focus on fish stocking programs, invasive species management, environmental flow acquisition and management, infrastructure fixes like for fish passage, as well as habitat creation and rehabilitation.
Reclamation funds research to create better tools and science in support of the restoration conducted under these programs. I new issue of Reclamation’s “Knowledge Stream” is now out describing the role Reclamation plays in funding these efforts and highlights some examples.
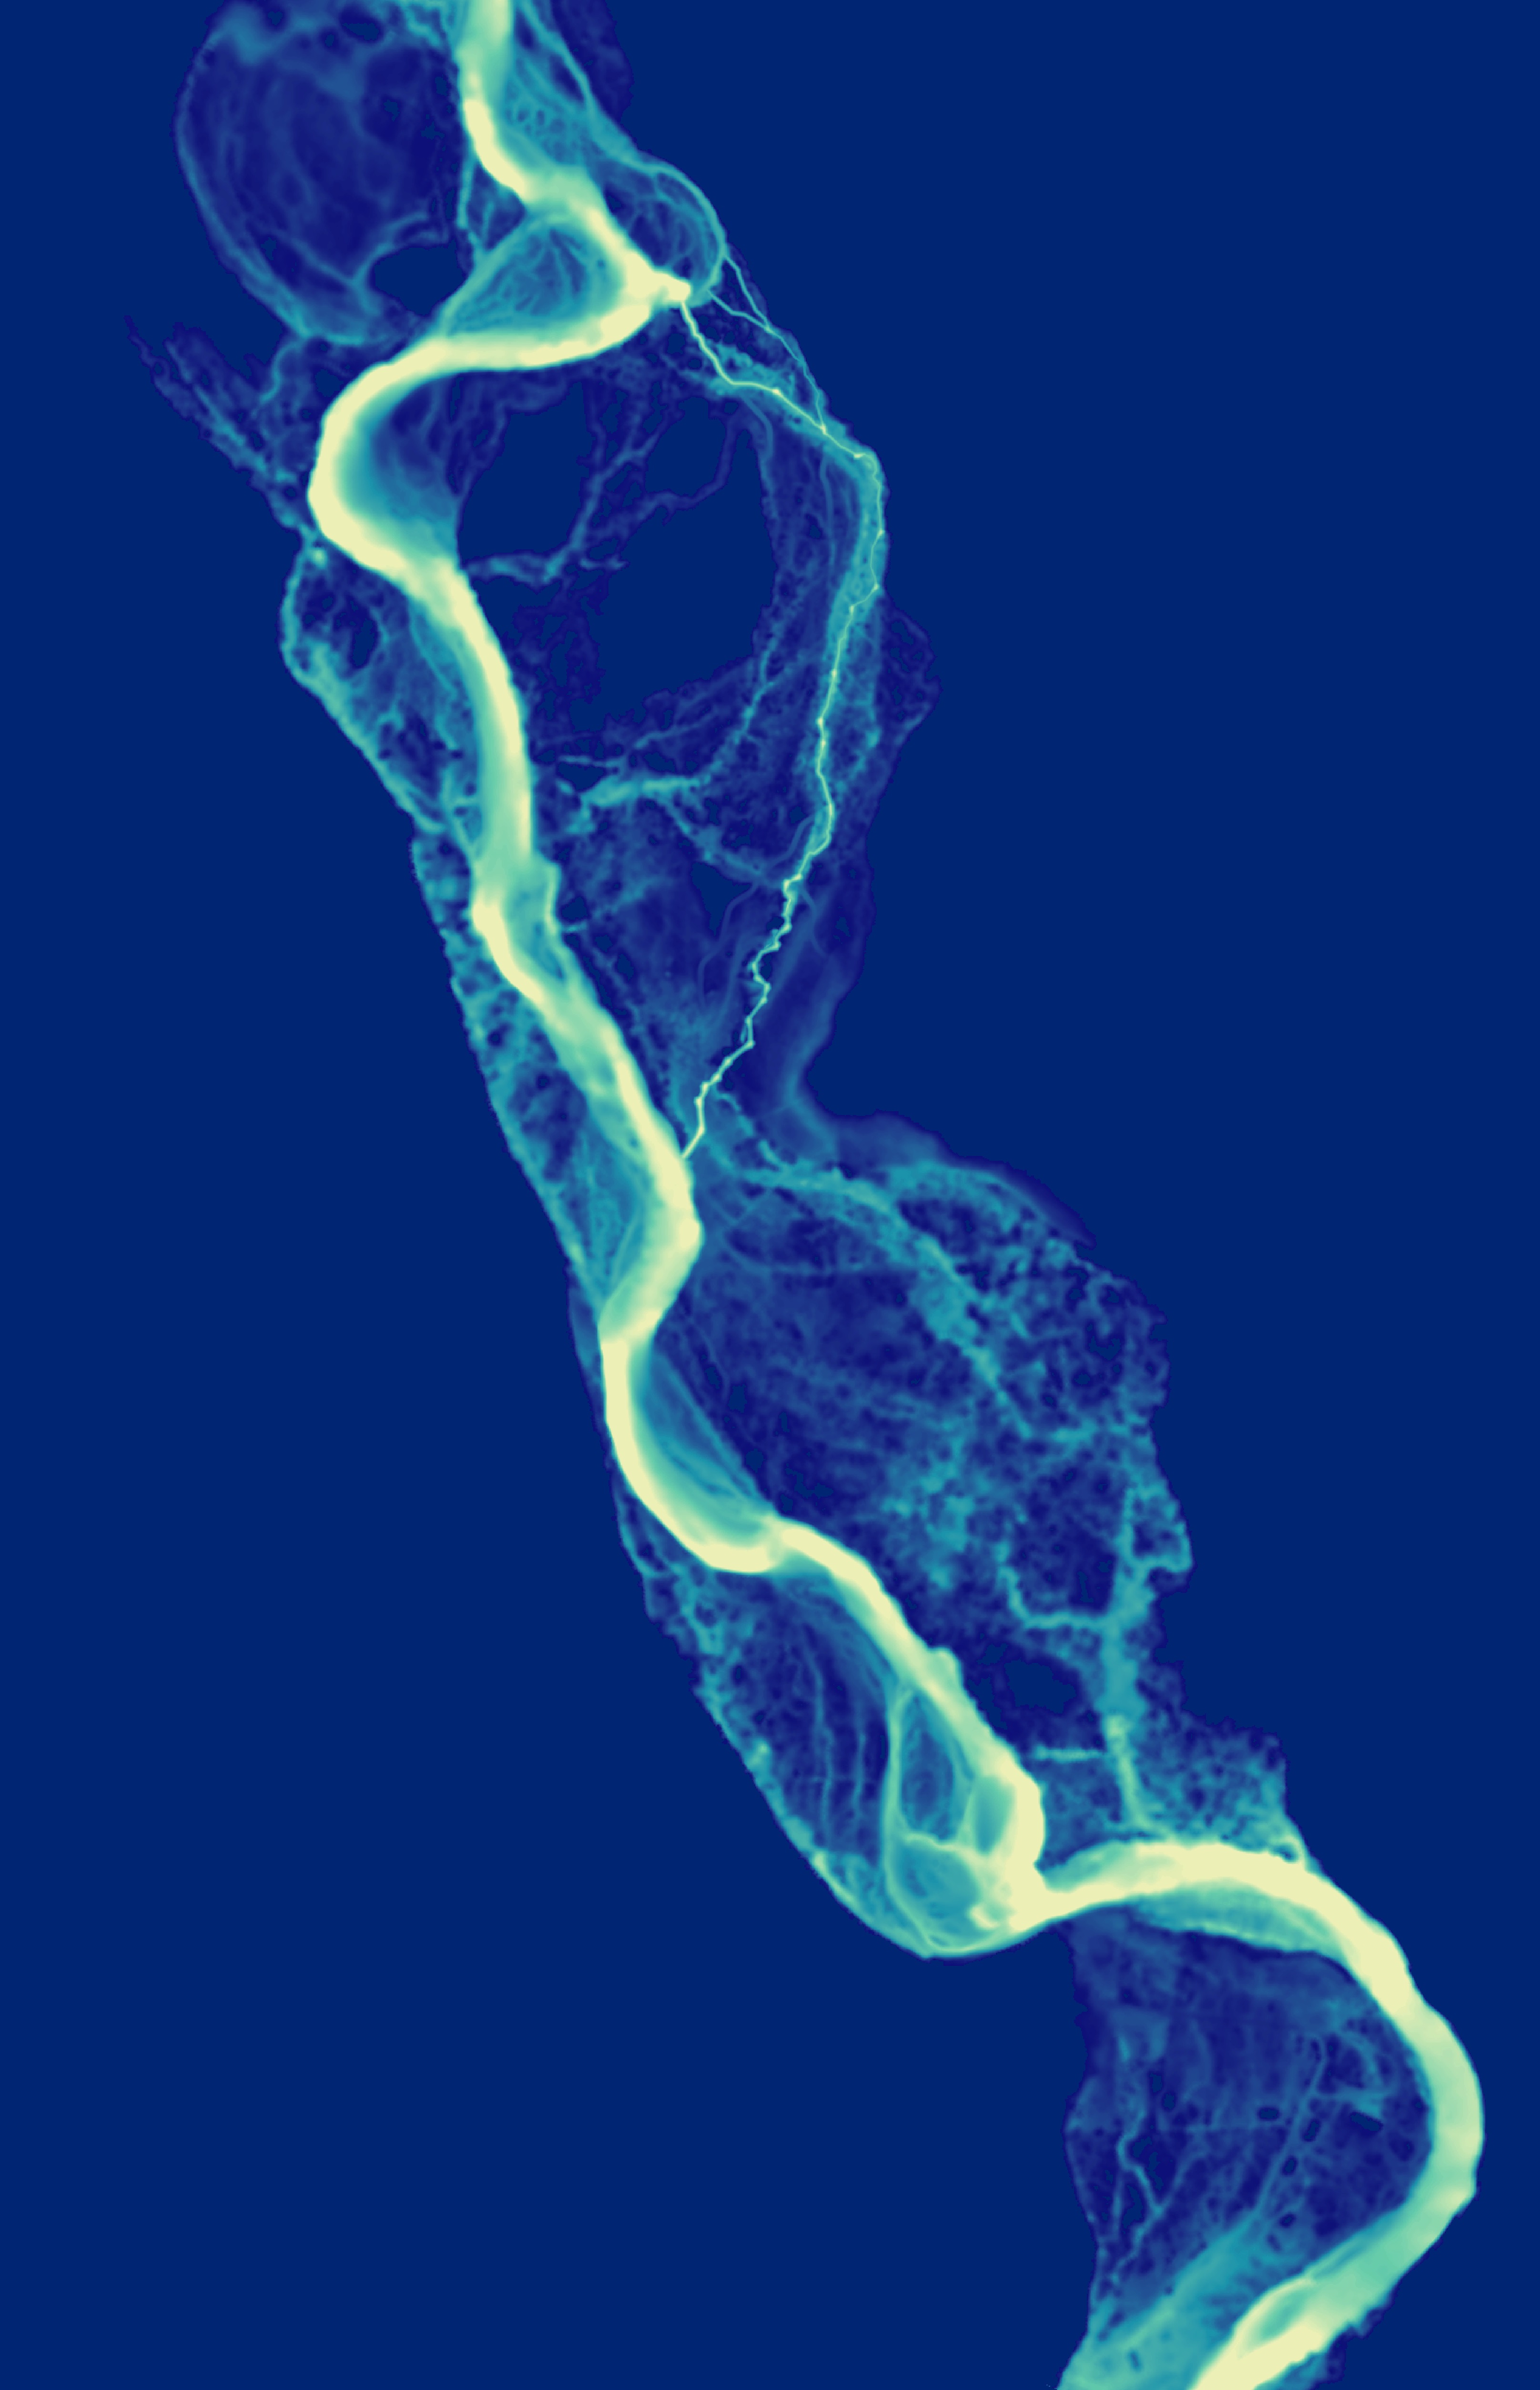
Rivers are transient features, scrolling across a landscape in fits (floods) and spurts (progressive bank erosion and point bar building over the years). This image of the Chewuch River in northwestern Washington depicts the shadows of previous channel locations (light blue green) left behind as the main channel (bright yellow) migrates down its valley. It shows the relative depth of flow from the 1% annual chance flood modeled two-dimensionally. Old channel locations may be abandoned or fill in over time. These relicts become side channels that function as important habitat for juvenile salmon where slower, shallower waters provide a nursery for these young fish. When banks are armored with ripap to prevent erosion and protect development, this natural migration process slows down or stops. Less channel migration means less recruitment of trees and wood into the river, which create and maintain important habitat. It also means the creation and maintenance of these ghost channels goes away.
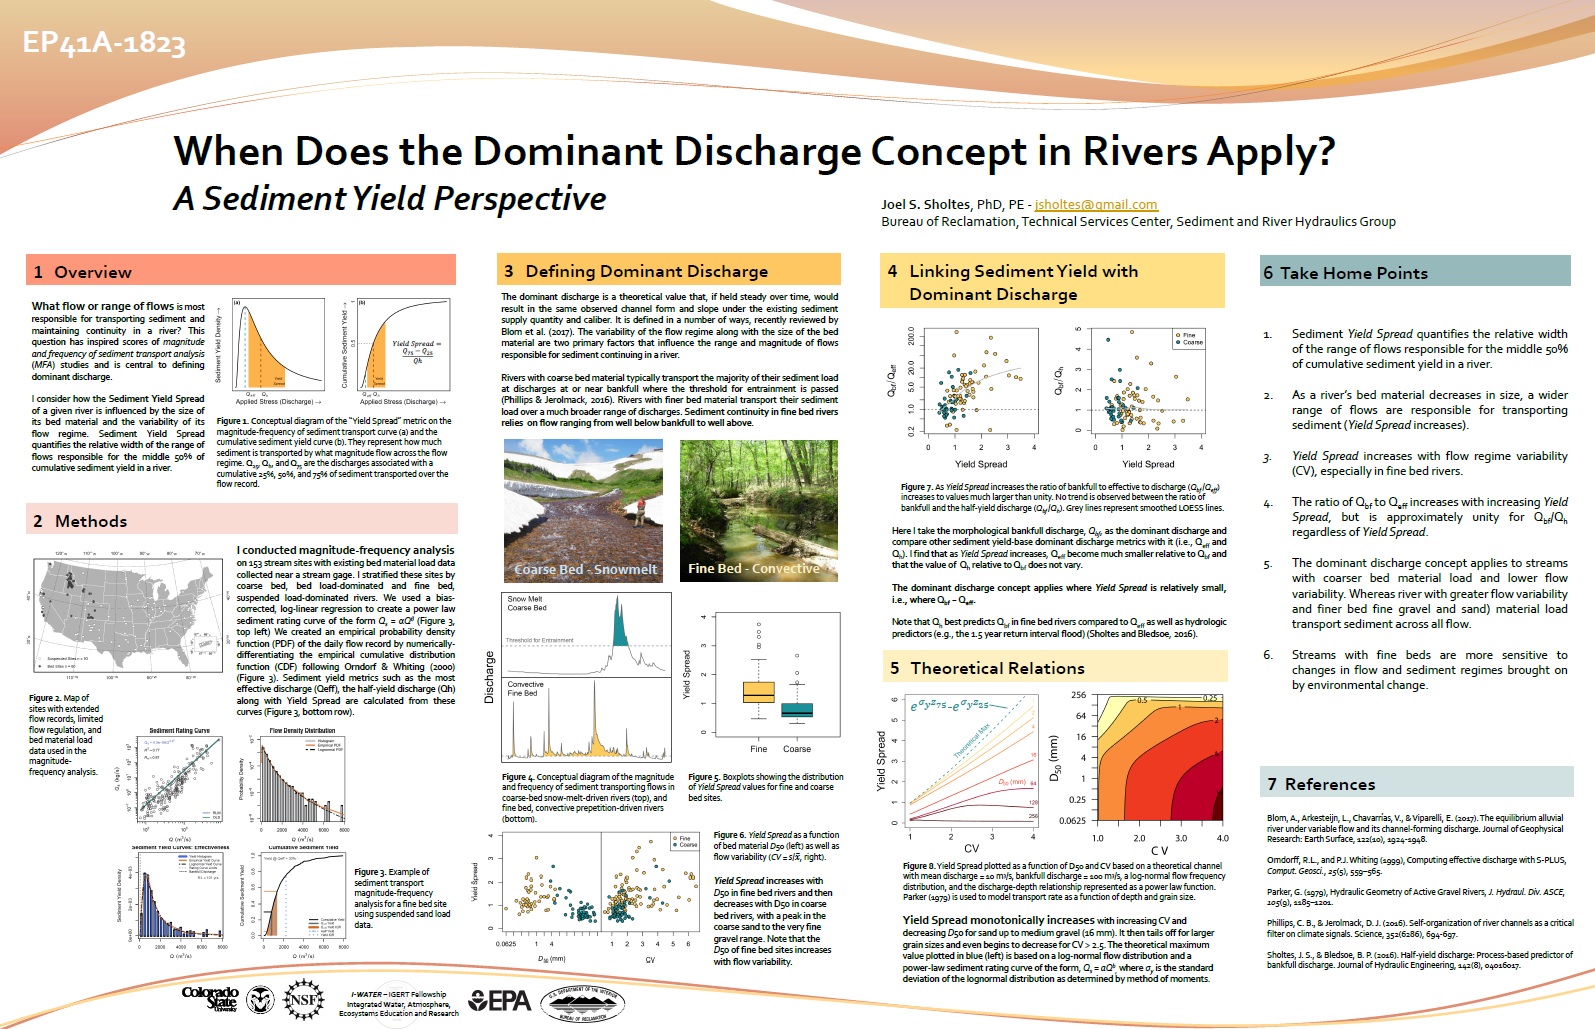
What flow or range of flows is most responsible for transporting sediment and maintaining continuity in a river? This question has inspired scores of magnitude and frequency of sediment transport analysis (MFA) studies and is central to defining dominant discharge.
The dominant discharge is a theoretical value that, if held steady over time, would result in the same observed channel form and slope under the existing sediment supply quantity and caliber. It is defined in a number of ways, recently reviewed by Blom et al. (2017). The variability of the flow regime along with the size of the bed material are two primary factors that influence the range and magnitude of flows responsible for sediment continuing in a river.
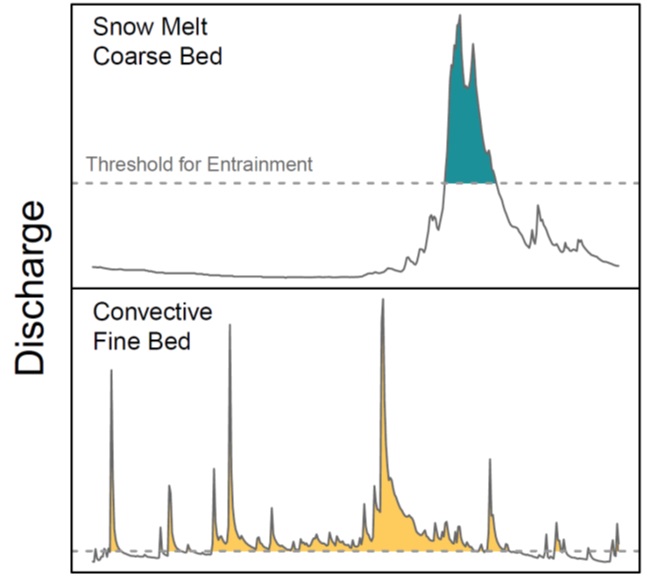
Rivers with coarse bed material typically transport the majority of their sediment load at discharges at or near bankfull where the threshold for entrainment is passed (Phillips & Jerolmack, 2016). Rivers with finer bed material transport their sediment load over a much broader range of discharges. Sediment continuity in fine bed rivers relies on flow ranging from well below bankfull to well above.
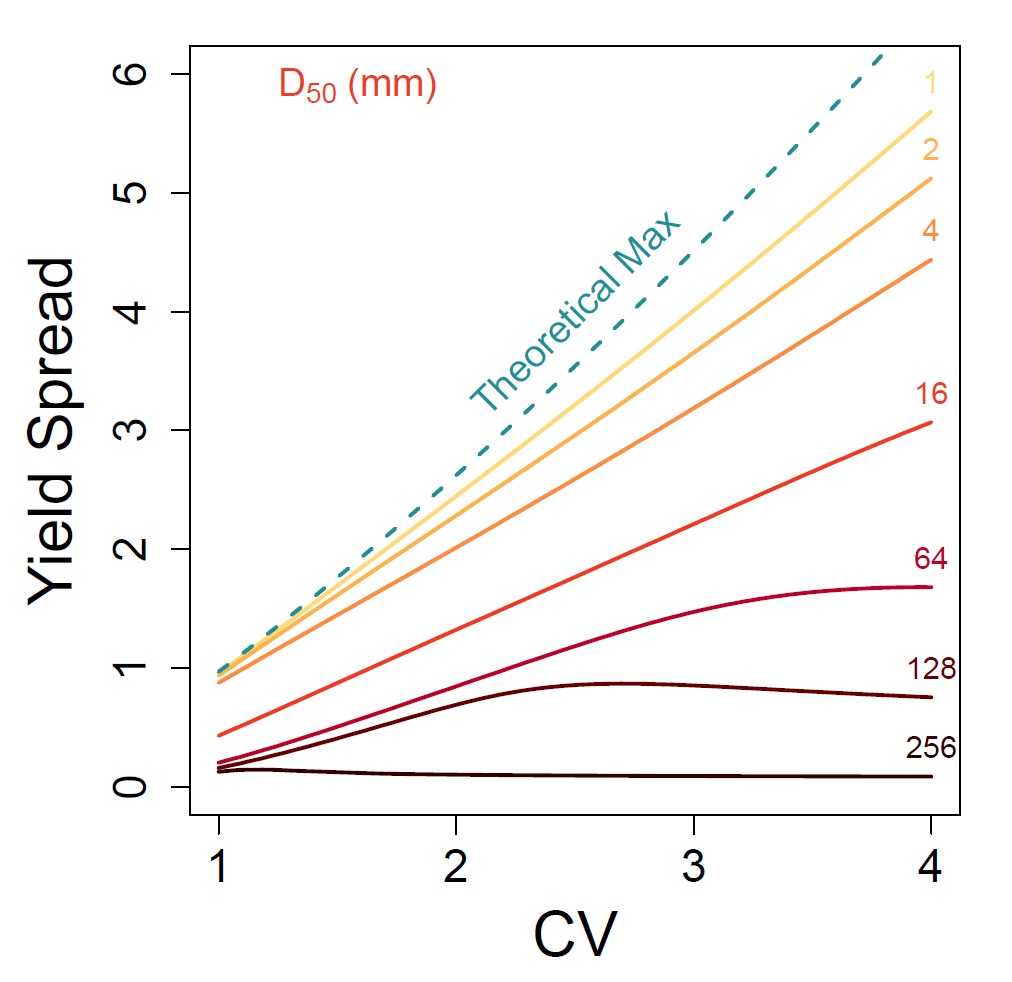
Yield Spread monotonically increases with increasing the coefficient of variation of the daily flow regime (CV) and decreasing median grain size (D50) for sand up to medium gravel (16 mm) in a hypothetical river. It then tails off for larger grain sizes and even begins to decrease for CV > 2.5. I used the Parker (1979) sediment transport relation along with a lognormal distribution to represent the flow regime (Q mean = 10 cms).
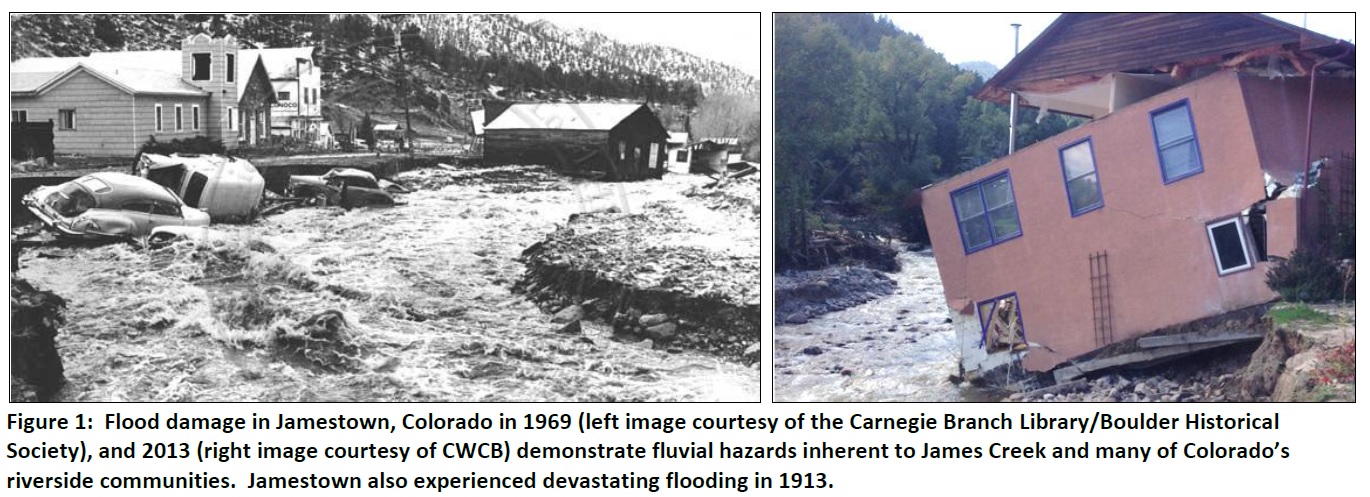
The State of Colorado authorized funding to expand and modernize its hazard mapping program after the 2013 Front Range flood. This includes millions of dollars for LiDAR acquisition, updated and new inundation maps, debris flow risk mapping, and fluvial hazard mapping. I am working on a team of geomorphologists, planners, and engineers to develop guidance and a protocol for mapping the, “Fluvial Hazard Zone”, defined as the area along a river that can be physically influenced via erosion and deposition, during a flood. Infrastructure, homes, and livelihoods were lost during the 2013 floods when the Front Range Rivers altered their courses and eroded hillslopes, undermining structures well above the regulated 1% annual exceedance probability (100-year recurrence interval) floodplain. The aim of mapping fluvial hazards is to give communities more information on flood risk to inform their residents and potentially adopt these boundaries into floodplain permitting and land use management on a voluntary basis.
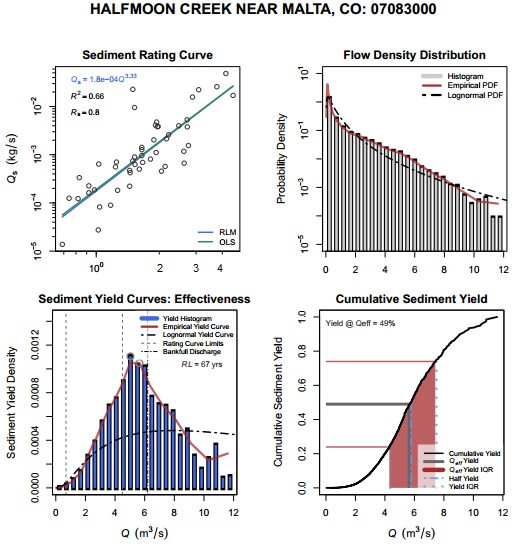
Yes, you can breath again: my dissertation is now online in all its glory: On the Magnitude and Frequency of Sediment Transport. Here you can find the text as well a an exhaustive set of appendices andall of the data and code! Here is a document description the R and Matlab scripts I used in the research. So, for all of you folks interested in crunching some flow and sediment data, have at it. Below is an example of the type of data and analyses involved in this research: sediment transport data and log-log regression, flow data and flow frequency analysis, and then magnitude frequency analysis expressed as the effectiveness curve (sediment yield density curve), as well as cumulative sediment yield curve. Various sediment yield metrics are also indicated on the bottom two panels.


 Turns out statistical hydrology is a lot like giving a gumball to a toddler… more on that later.